
As you start to use Basement's Q for Email to analyze your conversations, you will need to understand the important data points and definitions so you can get the most out of it.
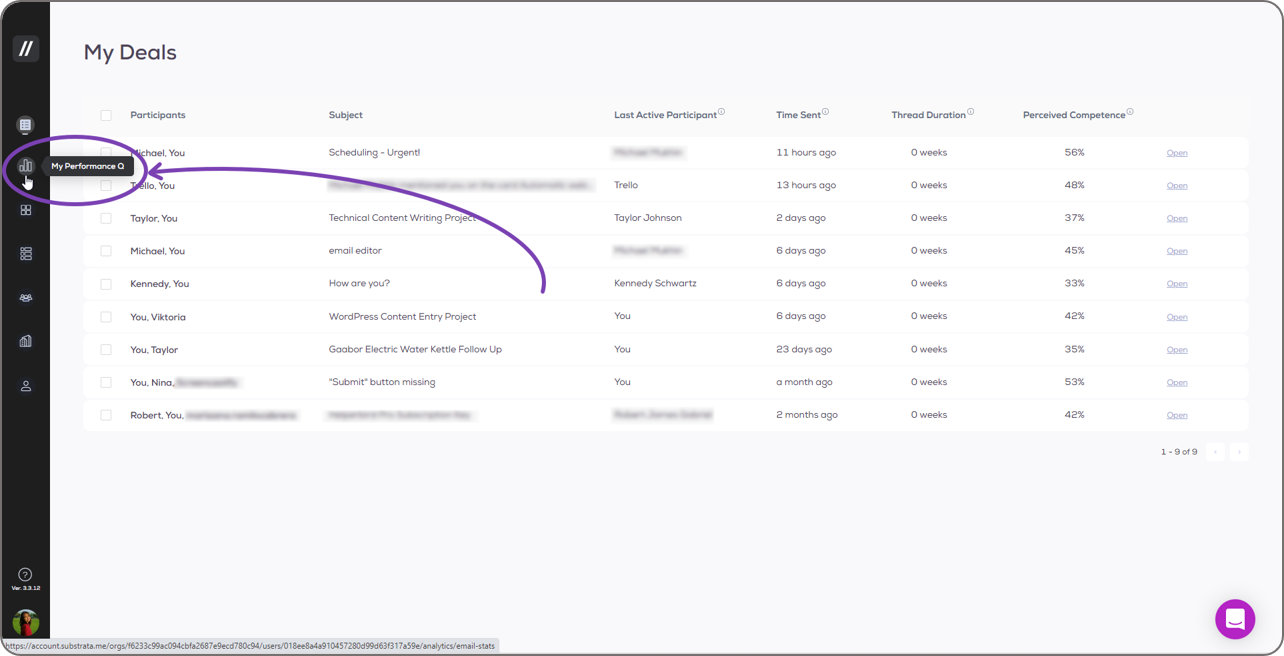
You can find these in your My Performance Q page. To access this page, click the My Performance Q button on the navigation pane on the left-hand side of the screen. The button's label will appear when you hover your mouse cursor over them.
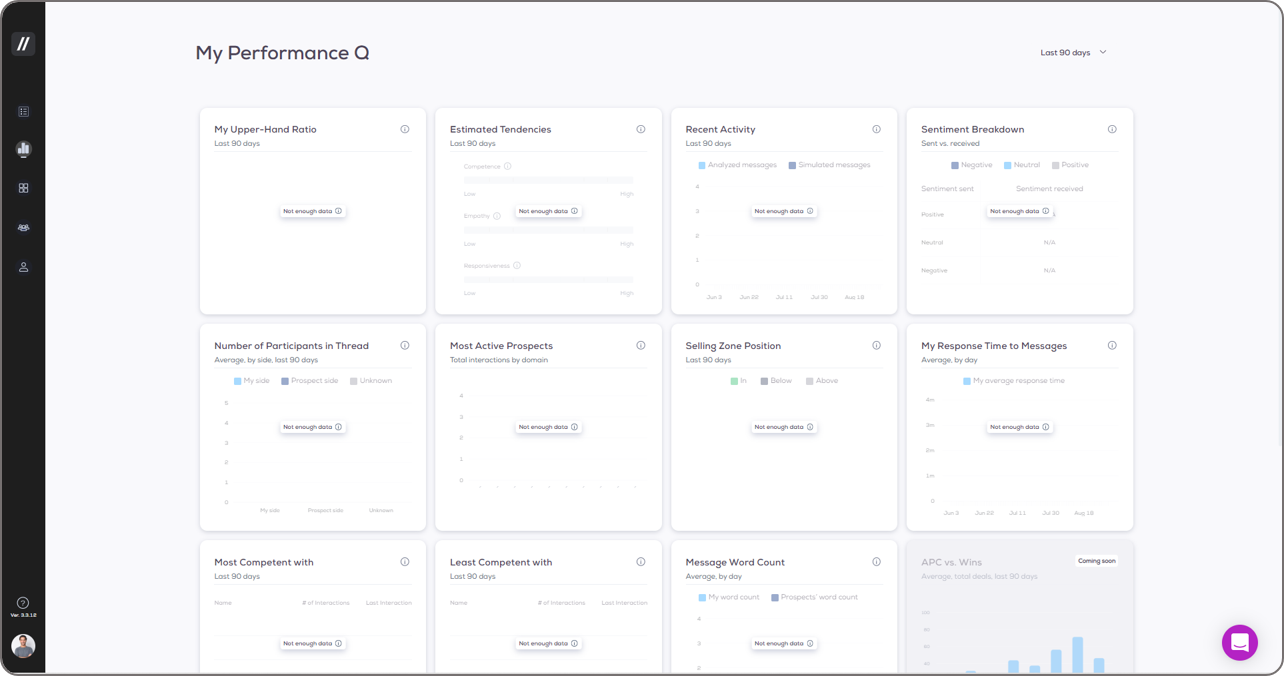
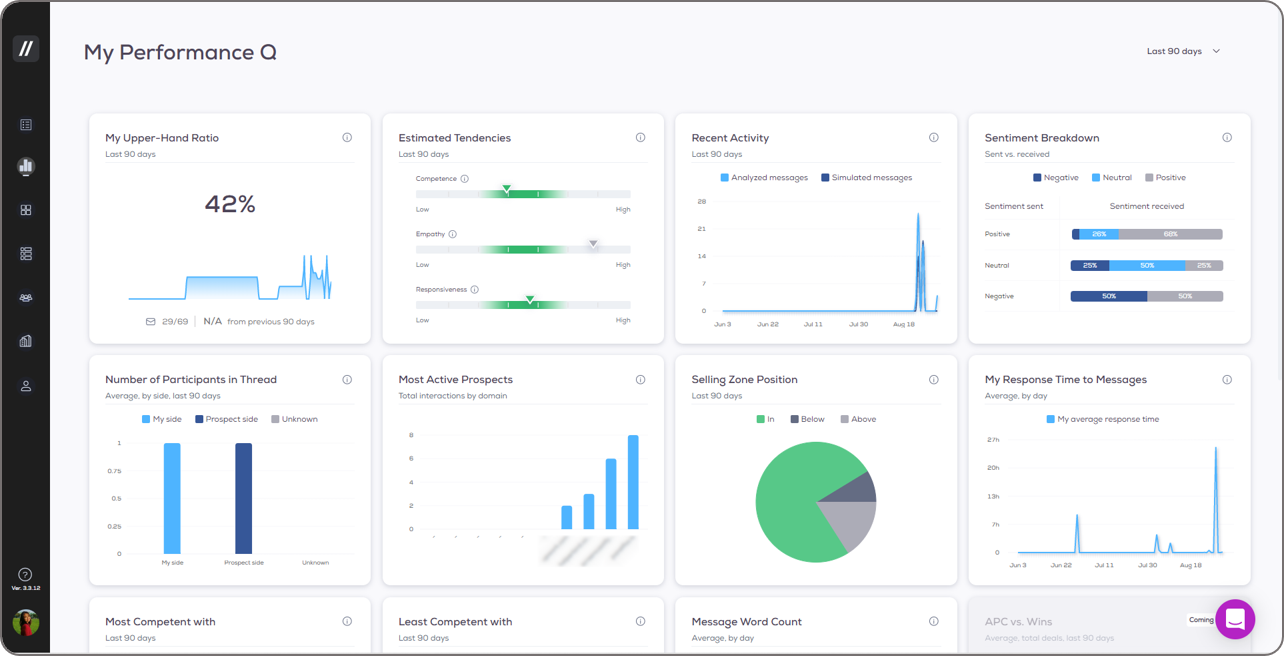
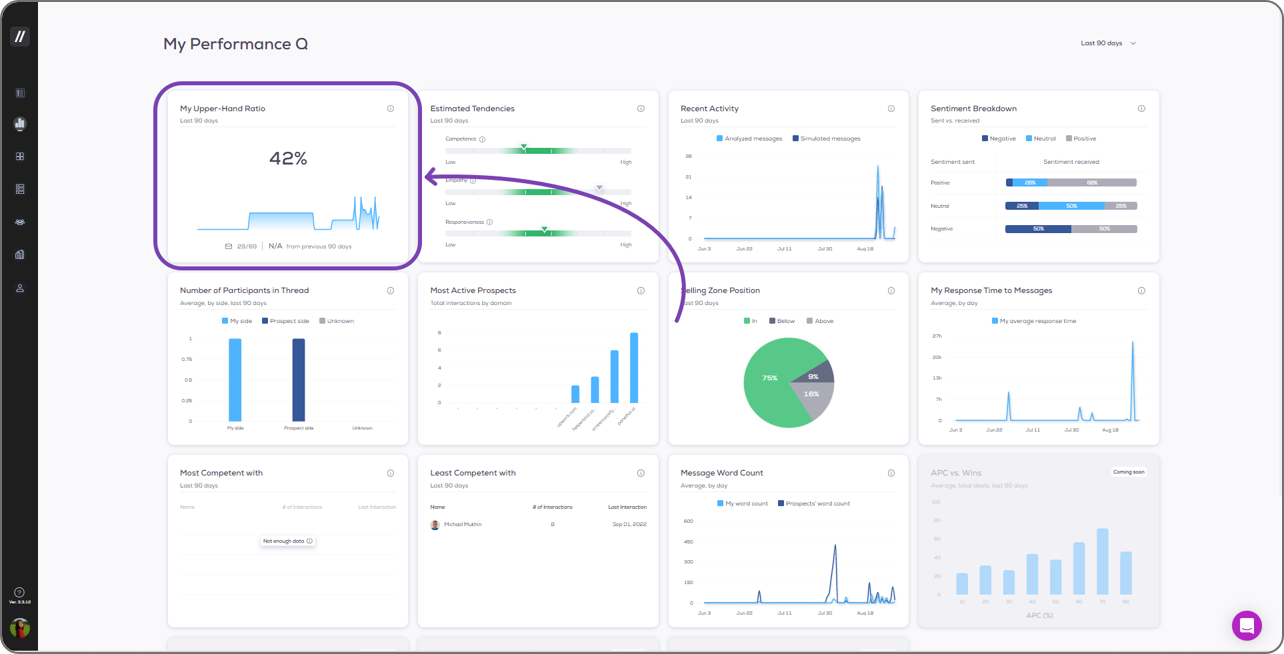
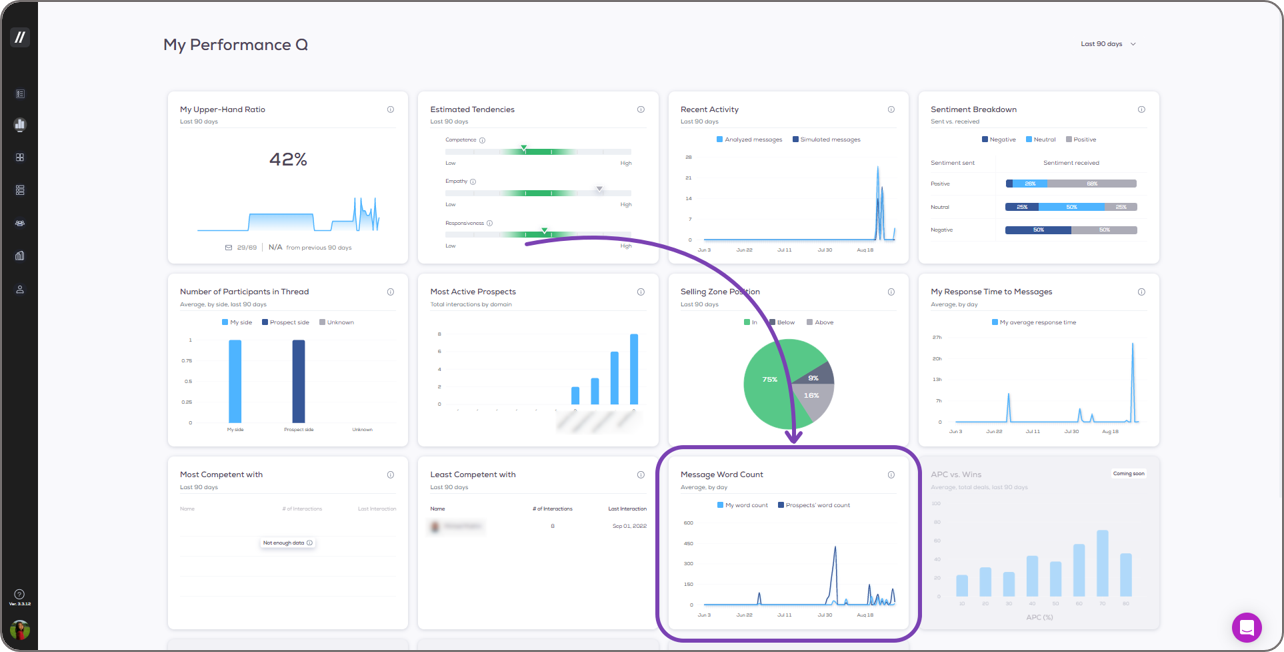
This is the My Performance Q page:
The important data points and definitions that you need to be familiarized with are as follows:
Upcoming features:
APC vs. Wins
Outgoing email activity
Incoming email activity
APC vs. Sales Cycle
My Performance Q Data
My Upper-Hand Ratio
The percentage of messages when you had the Upper-Hand. This number is based on the messages in which you were the sender or main recipient.
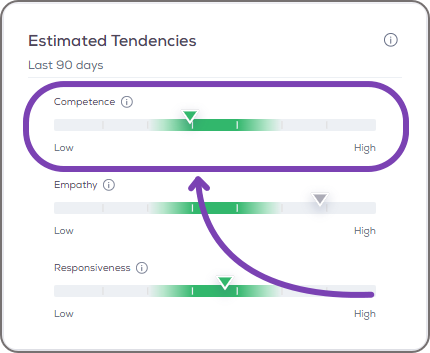
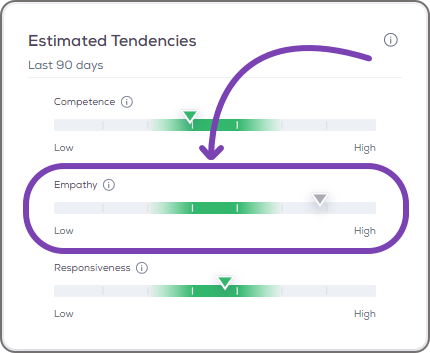
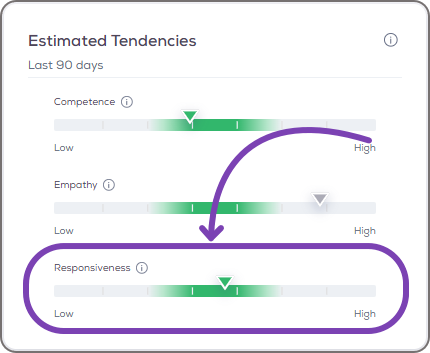
Estimated Tendencies
Estimated tendencies based on your overall email communication. Try to be in the recommended range to be perceived more favorably by your prospects.
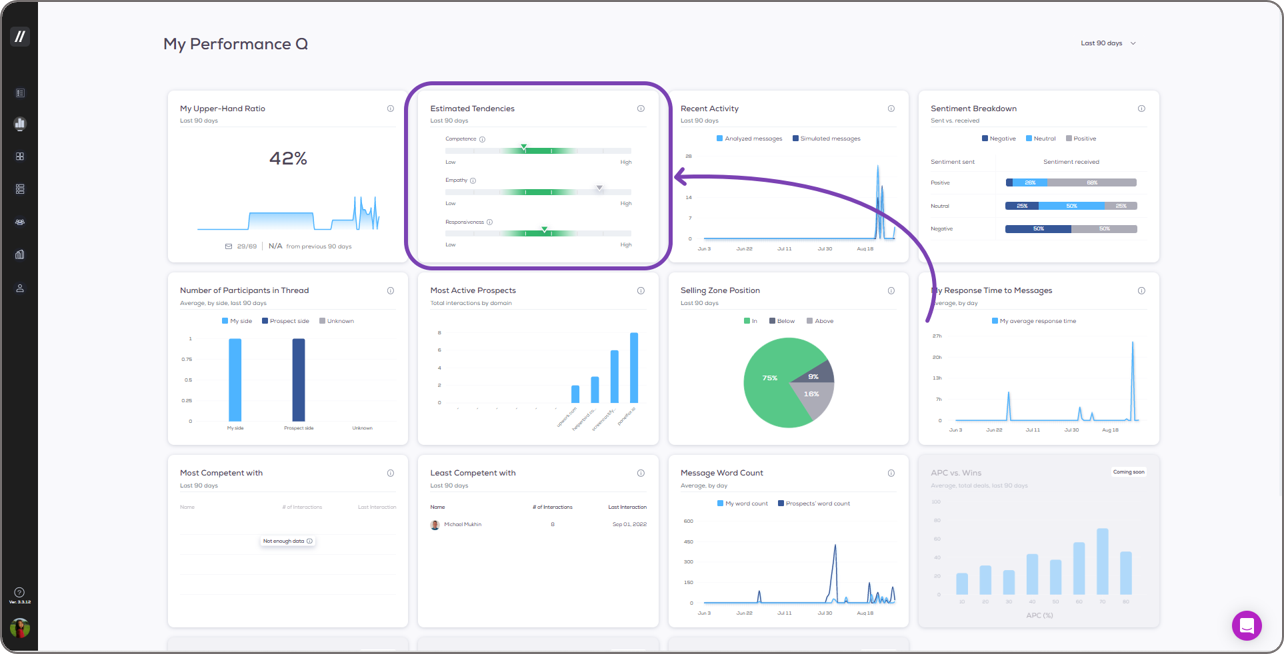
There are three attributes to your estimated tendencies:
Competence
This shows the distribution of sentiment received from prospects vs. the sentiment you have conveyed in the message you sent them.
Empathy
Empathy allows you to walk a mile in your prospects' shoes and understand their pain points and motivations. Being too empathetic may sacrifice your advantage, while not showing enough empathy may come across as being indifferent.
Responsiveness
Your average response time to your prospects. This may impact the way they perceive you. Responding too quickly may signal overenthusiasm, while responding too slowly may signal a lack of motivation.
Recent Activity
The number of messages you analyzed and/or simulated per day in the selected time period.
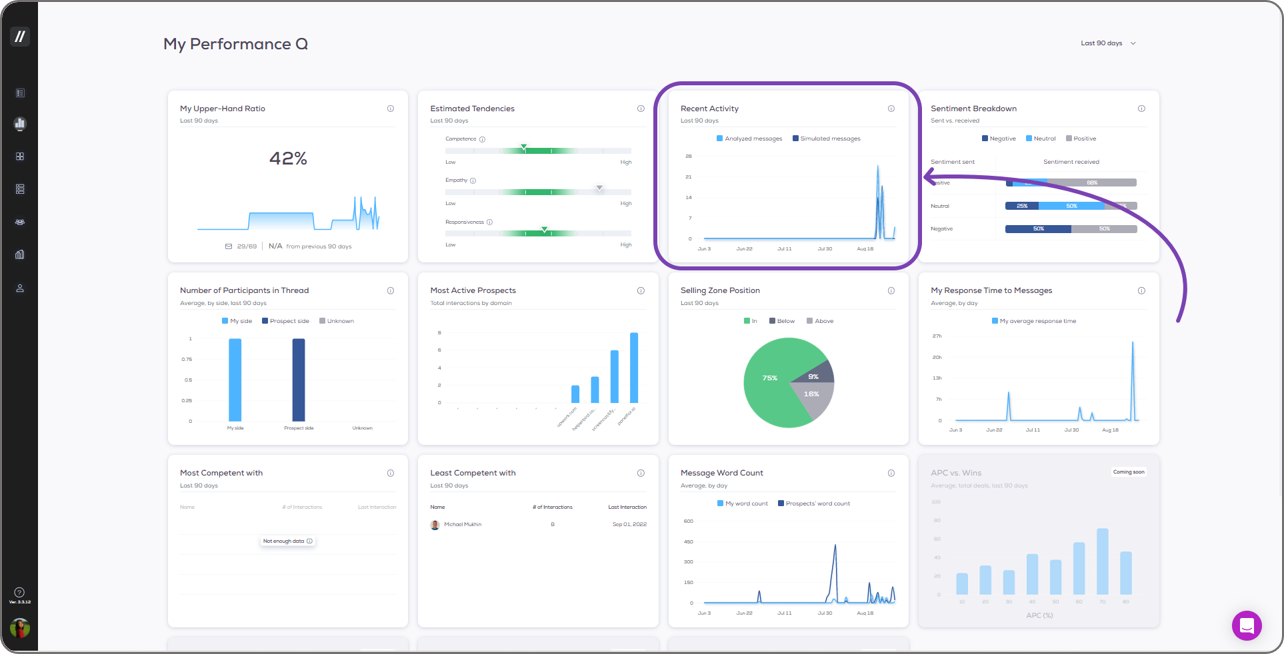
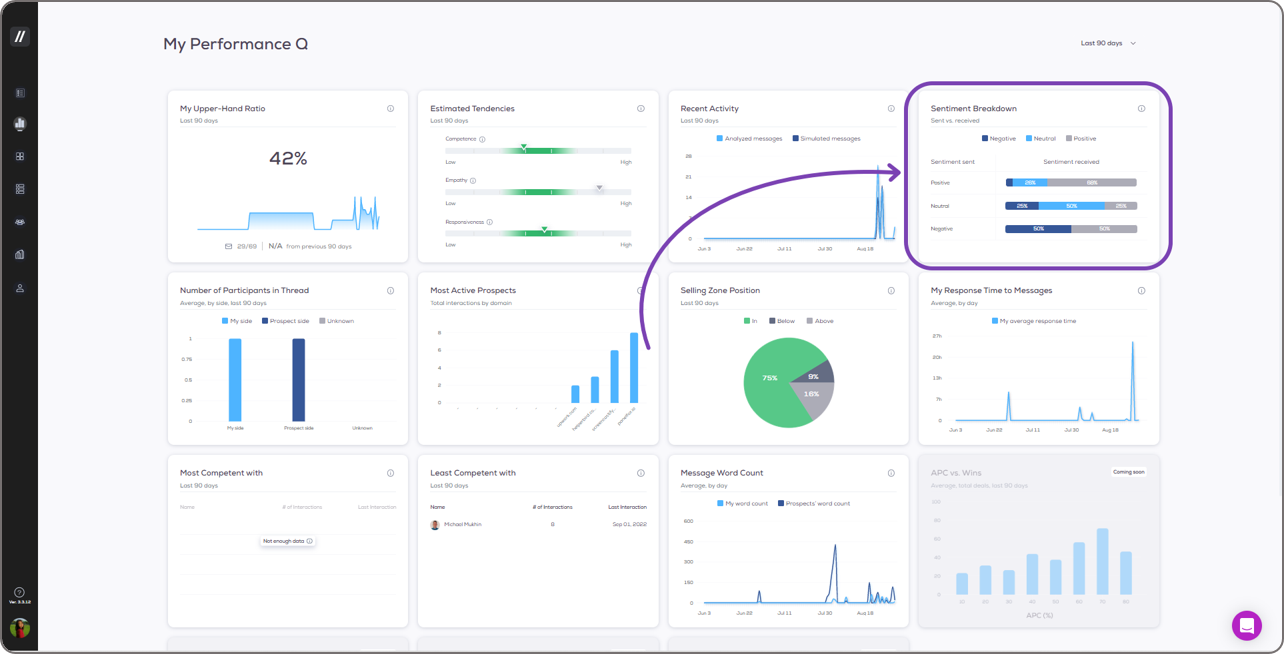
Sentiment Breakdown
This shows the distribution of sentiment received from prospects vs. the sentiment you have conveyed in the message you sent them.
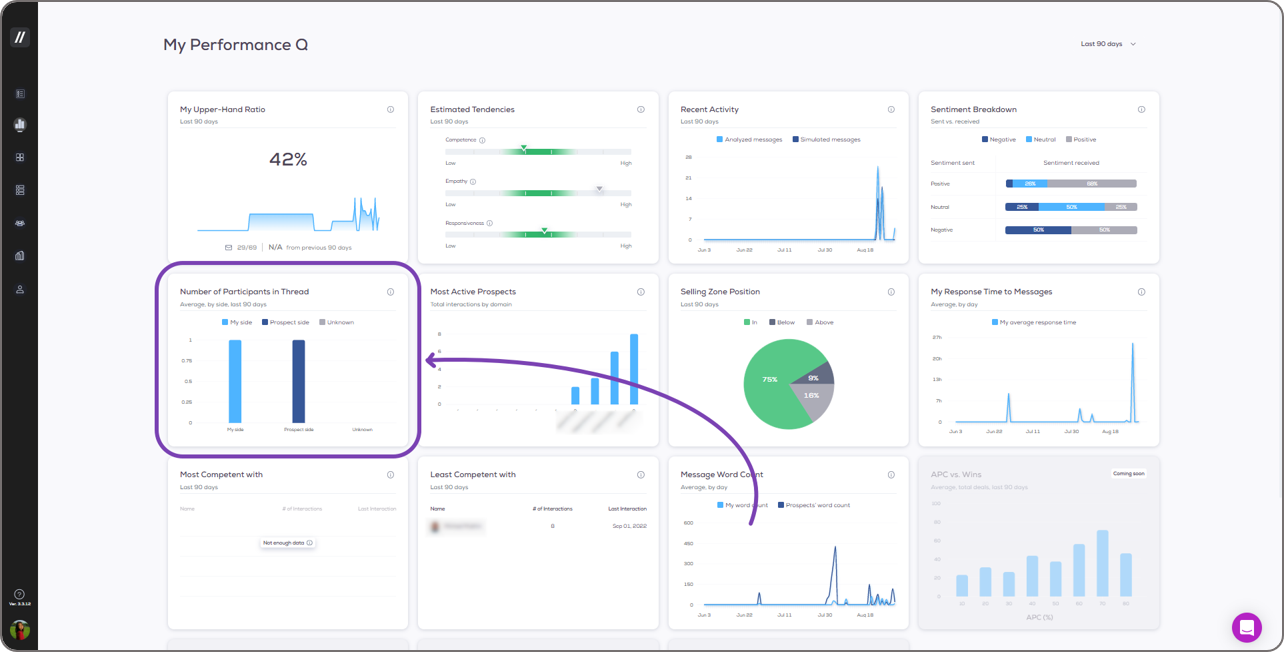
Number of Participants in Thread
The average number of participants in a thread, by side, for the selected time period.
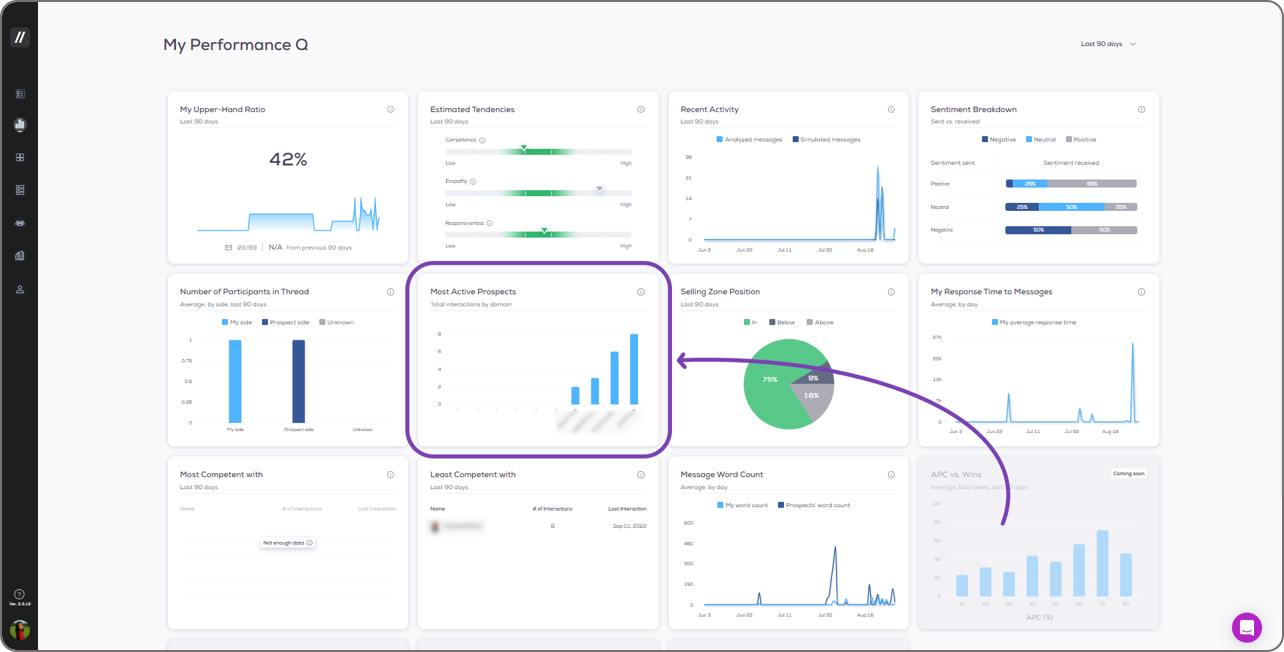
Most Active Prospects
Most active prospects for the selected time period. The bar height represents the total messages in that period between you and all of the participants from that domain.
Selling Zone Position
Most active prospects for the selected time period. The bar height represents the total messages in that period between you and all of the participants from that domain.
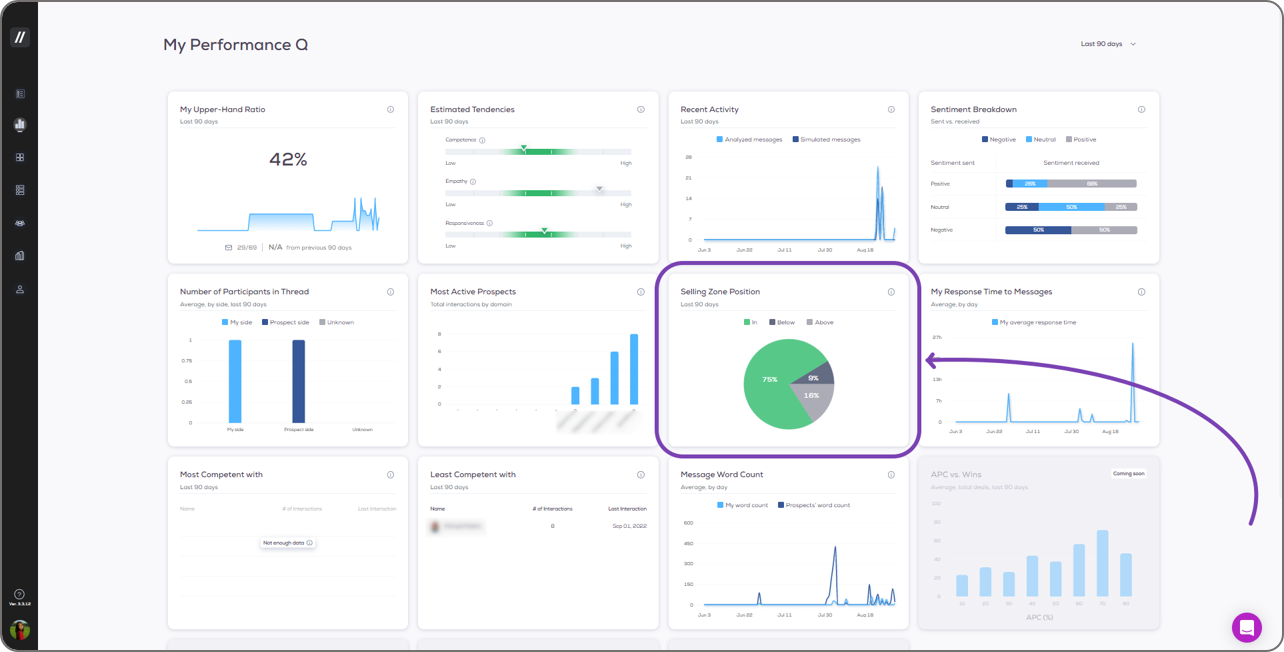
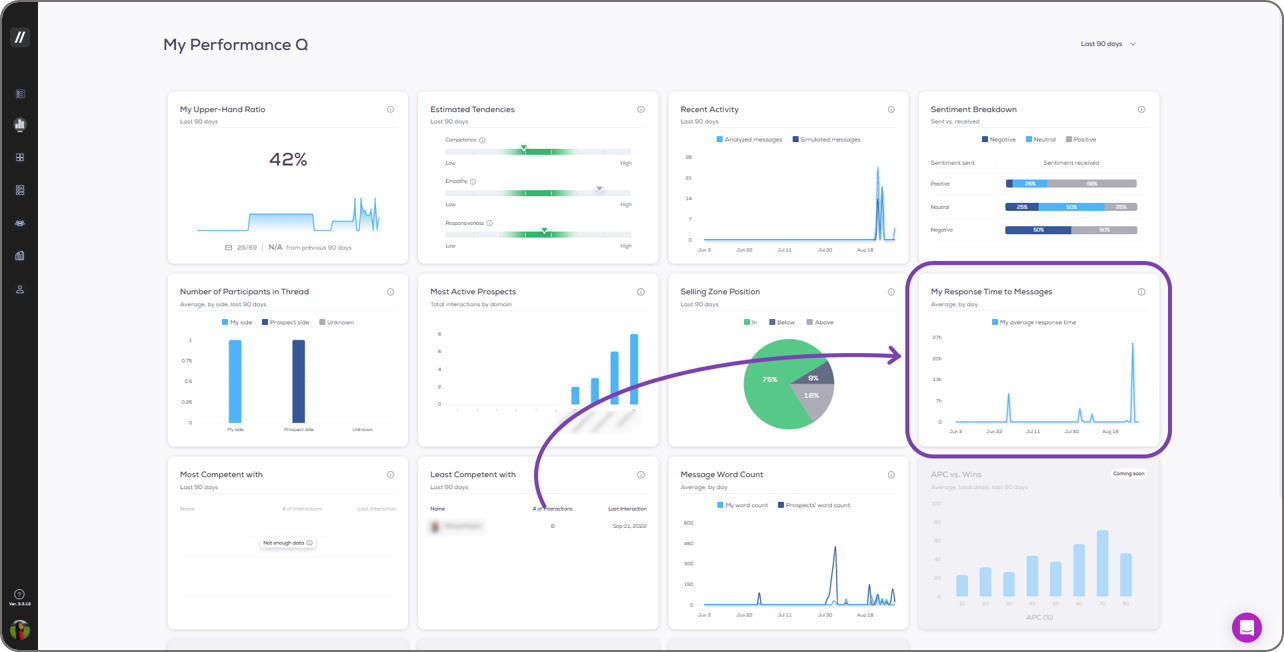
My Response Time to Messages
Most active prospects for the selected time period. The bar height represents the total messages in that period between you and all of the participants from that domain.
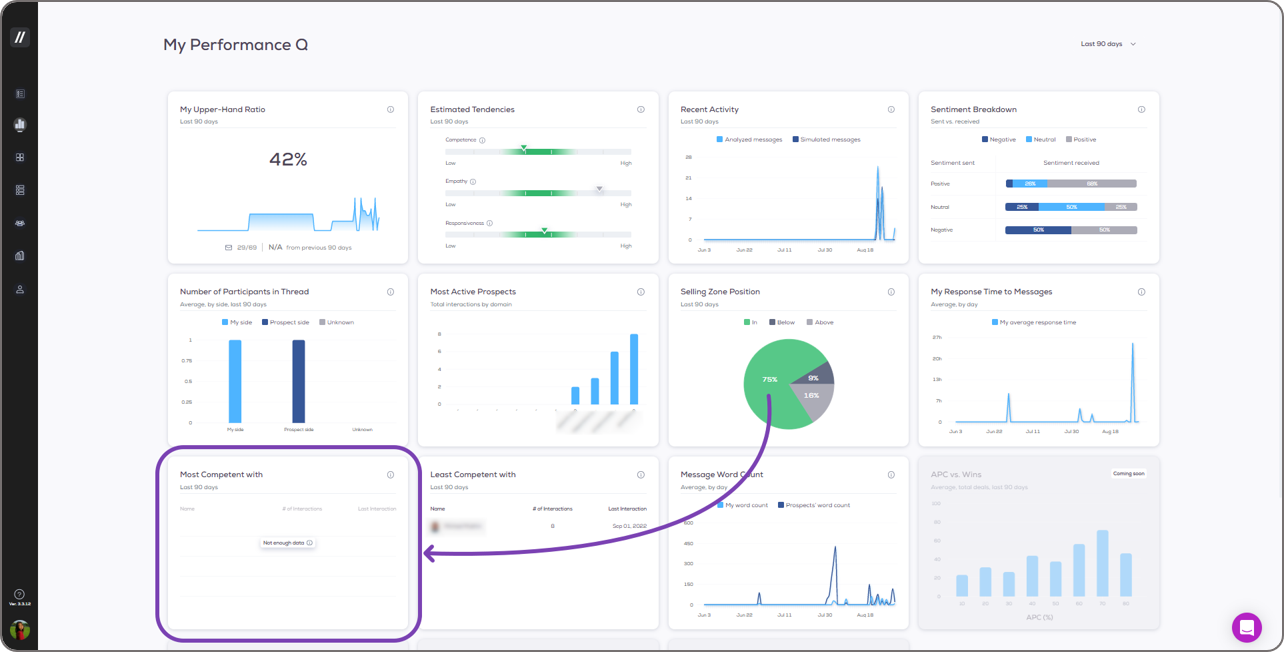
Most Competent with
People outside of your organization whom you are most competent with, on average, during the selected time period.
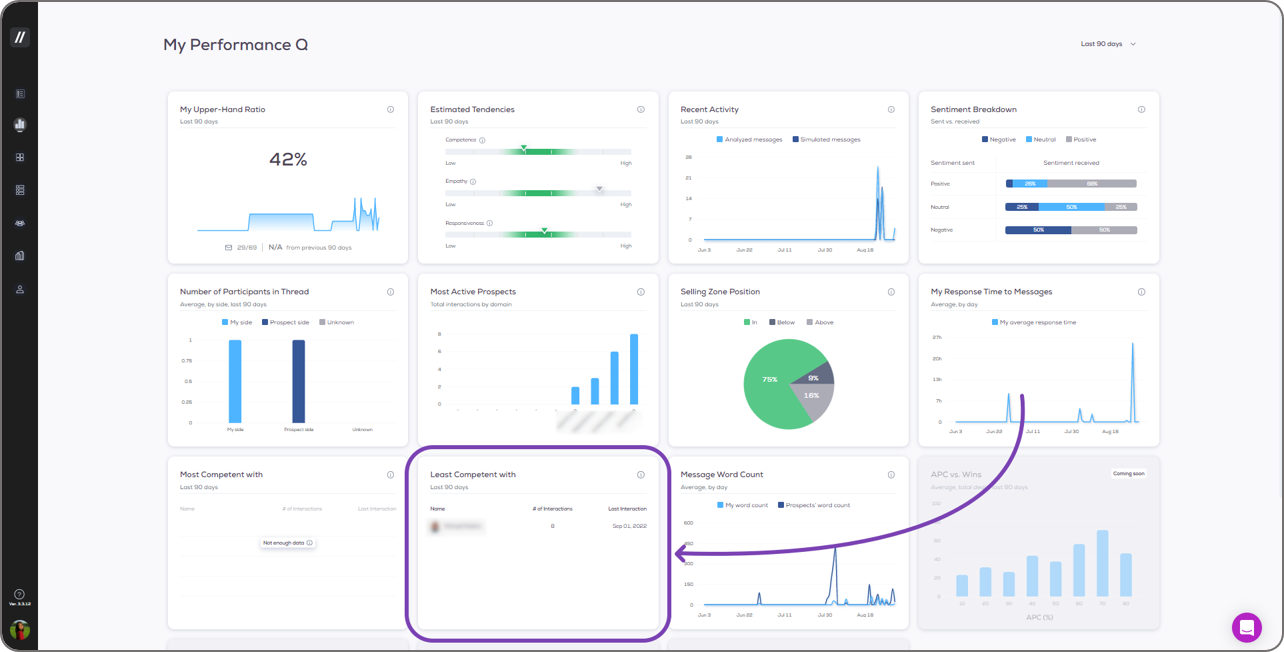
Least Competent with
People outside of your organization whom you are most competent with, on average, during the selected time period.
Message Word Count
This shows the average word count of your messages compared to that of your prospects.
Why is my Performance Q page blank?
Your Performance Q page may be blank if the system doesn’t have enough interaction history yet to produce an accurate analysis of your performance for you. Start analyzing emails to build up your data!